Collecting logs #
CloudWatch #
- region scope
- fault tolerant
- durable
- push, not pull
Everything in CW logs is going to be stored in a log group
A log stream - entity, which records into particular log group
A log record - is a single record of some event
# log group operations
aws logs create-log-group
aws logs delete-log-group
aws logs associate-kms-key

# log stream operations
aws logs create-log-stream
aws logs delete-log-stream

# log record operations
aws logs put-log-events
aws logs get-log-events
aws logs get-log-record
Intagration with another services #
| service | type of logs |
|---|---|
| CloudTrail | itself logs |
| API Gateway | Access/Execution logs |
| ECS | Container logs |
| Lambda | Execution logs |
| RDS | DB logs |
| Systems Manager | Run |
| EC2 | App/OS logs |
CloudTrail #
- region scope
- audit log
- logs both success and failure
- works with different types of events:
- management
- data
- insights
- organizations support
# trail operations
aws cloudtrail create-trail
aws cloudtrail delete-trail

# logging operations
aws cloudtrail start-logging
aws cloudtrail stop-logging

# validation operations
aws cloudtrail validate-logs
Analyzing logs #
CloudWatch insights #
- use existing log group/stream
- (sql-like) query engine
- alarm integration
# Create query
aws logs put-query-definition
aws logs delete-query-definition

# execute query and get results
aws logs start-query
aws logs stop-query
aws logs get-query
CloudTrail insights #
- use existing events
- ML-driven
- no query engine
aws cloudtrail put-insights-selectors
aws cloudtrail get-insights-selectors
ElasticSearch and Kibana #
- region scope
- analytics engine
- reporting engine
- CWL integration
Exporting logs #
CWL export #
- S3 export
- CLI tail
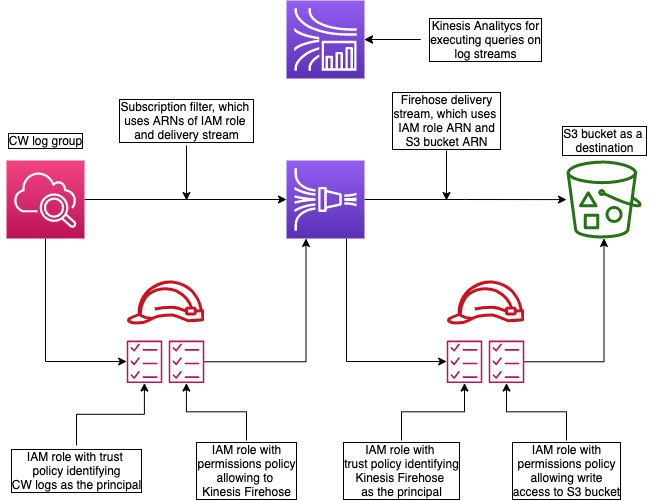
- subscription filter - automatically delivers logs from CW to tne another service:
- kinesis stream
- lambda function
- kinesis data firehose
- logical destination
# create or delete export task
aws logs create-export-task
aws logs cancel-export-task

# live tail of log stream
aws logs tail

# create new subscription filter
aws logs put-subscription-filter
  --log-group-name
  --filter-name
  --filter-pattern
  --destination-arn
  --role-arn
Kinesis data firehose #
This is a sort of batch mechanism
- region scope
- streaming pipeline
- buffer and batch
Possible destinations:
- S3
- Redshift
- ES
- HTTP endpoint
- Datadog
- MongoDB
- New Relic
- Splunk
Kinesis Firehose delivery to S3:
CloudWatch Alarm #
Terms #
Period - length of time evaluate metric or expression to create an individual data point
Evaluation Perion - number of data points to evaluate when determining alarm state
Datapionts to Alarm - number of data points within evaluation period that must be breaching to cause ALARM state. Does not have to be consecutive.
Evaluation range - number of data points retrieved by CW for alarm evaluation. Greater than Evaluation Period but varies.
Missing data points #
- missing - alarm doesn’t consider messing data points at all
- notBreaching - missing data points treated as being within threshold
- breaching - missing data points treated as breaching threshold
- ignore - current alarm state is maintained
Other alarms options #
- high resolution alarm - period less than 1 minute
- math expression alarm - combine up to 10 metrics
- percentile alarm - percentile as monitored statistics
- anomaly detection alarm - use standard deviation
- composite alarm - combine alarm state of other alarms
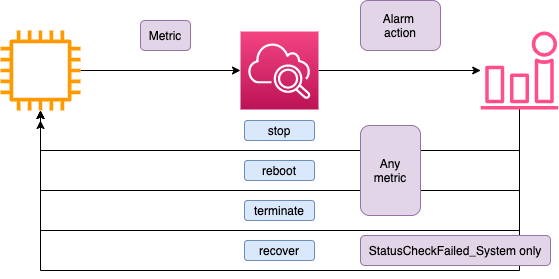
alarm actions #
- SNS topic:
- sms
- Lambda
- etc
- EC2 actions:
- stop
- reboot
- terminate
- recover
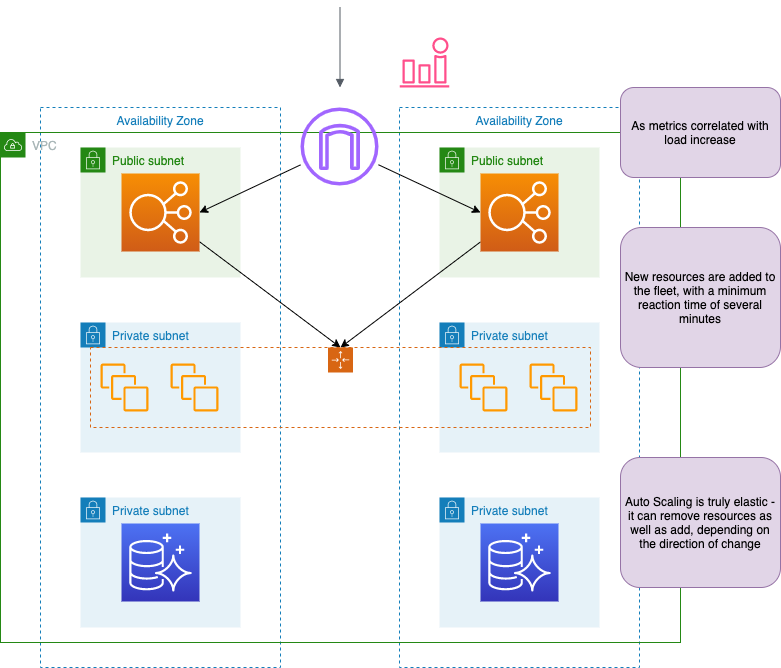
- Auto Scaling action
- Systems Manager (SSM) OpsItem
CloudWatch Metric Filters #
You can create a metric from a string with Metric Filters.
String Metric Filters basics #
- match everything -
"" - single term -
"ERROR" - include/exclude terms -
"ERROR" - "permissions"// will exclude all strings, which contains “permissions” - multiple terms using AND -
"ERROR memory exceprion" - multiple terms using OR -
?ERROR ?WARN
Space-delimited metric filter basics #
- specify all fields with a name, bounded by
[]and separated by commas - specify unknown number of fields with
"..." - add conditions:
=, !=, <, <=, >, >= - utilize
*to match partial string or numbers - implement AND with
&&and OR with||
# filter examples with Apache log

# match all 4XX response codes
[ip, id, user, timestamp, request, status_code = 4*, size]

# match response size > 1000 bytes
[ip, id, user, timestamp, request, status_code, size > 1000]

# ignore all redirect response codes
[ip, id, user, timestamp, request, status_code != 3*, size]
JSON metric filter basics #
{SELECTOR EQUALITY_OPERATOR STRING}- EQUALITY_OPERATOR is
=or!=
- EQUALITY_OPERATOR is
{SELECTOR NUMERIC_OPERATOR NUMBER}- NUMERIC_OPERATOR can be
=,!=,<,>,<=,>=
- NUMERIC_OPERATOR can be
- SELECTOR starts with
$, indicating the root of JSON- SELECTOR supports arrays
- implement AND with
&&and OR with|| - publish numerical value using
"metricValue:"
# filter example with CloudTrail log

# match all console login failures
{ ($.eventName = ConsoleLogin) && ($.responseElements.ConsoleLogin = "Failure") }

# match all console logins by IAM user john.doe
{ ($.eventName = ConsoleLogin) && ($.userIdentity.userName = "john.doe") }

# match all root user activity
{ $.userIdentiry.type = "Root" && $.userIdentity.invokeBy NOT EXISTS && $.eventType != "AwsServiceEvent" }
CloudWatch Dashboards #
Dashboard sharing:
- enable in settings
- share with specific IAM user(s)
- share publicly
- share via SSO
- share logs widgets
CloudWatch alarm remediation #
EC2 actions #
recover action mya be used only if underline HW has failed. It allows to move instance to the another HW. Also:
- certain instance types
- VPC only
- default or dedicated tenance
- no instance store
Autoscaling actions #
Manual actions #
If we recieve notification from CW alarm, we can fix the issue manually with AWS console or cli.
- performance metrics:
- scale horiaontally
- scale vertically
- availability metrics:
- restore
- recover
- fail over
Automated actions #
An SNS topik can trigger:
- custom endpoint (with any lind of script)
- Lambda funcition via API Gateway
- Lambda function directly
EC2 status checks #
- System reachability - represents host OS and hardware layer
- Instance reachability - represents guest OS and processes
EBS volume status checks #
- if volume NOT provision IOPs:
- ok
- warning
- impaired
- insufficient data
- in other case:
- Normal
- Degreded
- Stalled
- insufficient data
EventBridge rules #
EventBridge basics
- region based
- default event bus
- custom event bus
- sources and targets
- replay feature
- DLQ feature
Sources:
- CloudTrail API events
- GuardDuty findings
- Other service events
- Forwarded events
- Scheduled events
Rules is a JSON format match event properties:
- API gateway
- CW logs
- EC2 actions
- Remote event bus
- Lambda function
- SNS topic
Patterns:
- event
- schedule
Config rules and SSM automation documents #
Config basics
- region scope
- config streams
- partial coverage
- capture changes
- capture config
- snapshots
Config rule creation example
We have EC2 instance and AWS config. The last one will capture any changes in instance’s properties via config stream.
You can react for these changes via:
- AWS managed rules (for specific changes)
- custom rules via Lambda function